Every day is a learning day, and today I needed some way for my client to view the debug log for the Debug Version of an Application I created to test a piece of hardware which was acting up. After a little searching around I came across the Microsoft Sysinternals DebugView application; http://technet.microsoft.com/en-us/sysinternals/bb896647
Microsoft describe this DebugView as;
… an application that lets you monitor debug output on your local system, or any computer on the network that you can reach via TCP/IP. It is capable of displaying both kernel-mode and Win32 debug output, so you don’t need a debugger to catch the debug output your applications or device drivers generate, nor do you need to modify your applications or drivers to use non-standard debug output APIs.
So, in order to view the Debug Log I had already created in my App was as simple as;
- Download the DebugView Application from http://download.sysinternals.com/files/DebugView.zip
- Extract the contents of the ZIP to a location on your hardrive
- Run the DebugView Application as an administrator
- Run your Application
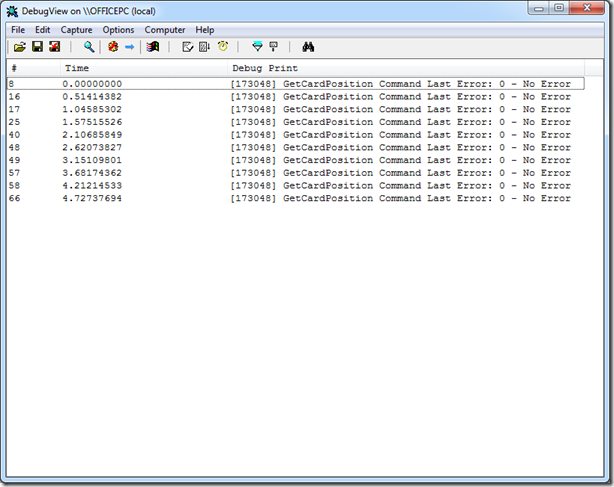
- Your Debug Messages will appear in the Window;
If you find that some other applications are also emitting debug information, then you can setup a filter, so that only your application is shown;
- Next to the Debug Messages for you application will be a number in square brackets. This is the PID of your application. Take a note of this number.
- Press the Filter/Highlight button;
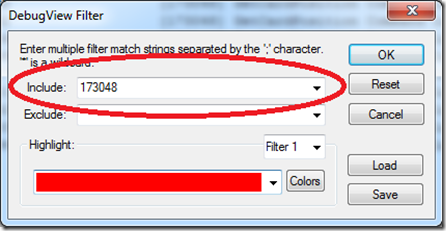
- The Filter Highlight dialog will be shown;
- In the Include Box, remove the Star and enter your PID;
- Press OK, and now you should only see the debug output from your application.
It’s worth noting that each time you start your application, it’s PID will change, so bear that in mind as your Filter will need adjusting to suit of course. You can either remove the filter to find your PID, or use Task Manager.
Very handy.


Leave A Comment
You must be logged in to post a comment.